Machine Learning at the Triage Desk
Predicting Critical ED Outcomes Across Two Independent Datasets
Harrell JA, Mahmoud A · Under Peer Review · 512,000+ ED encounters
View Figures & TablesBackground: Emergency department triage scales have limited accuracy for identifying patients who will need ICU admission, and whether NLP of chief complaints adds predictive value beyond structured triage data has not been established.
Methods: Retrospective cohorts from NHAMCS 2018–2022 (n=86,864; 2.02% critical outcome prevalence) and MIMIC-IV-ED (n=425,087; primary anchor-era temporal test n=77,026; sensitivity random-split test n=128,510) — totaling over 512,000 ED encounters. Primary analyses used temporal holdout validation (NHAMCS: train 2018–2021, test 2022; MIMIC: anchor-era split holding out the 2017–2019 patient cohort). Models used only predictors available within 5 minutes of ED arrival.
Results: In the primary NHAMCS temporal holdout (training 2018–2021, testing 2022; n_test=16,025), XGBoost achieved AUC 0.862. Multi-architecture convergence on pooled data confirmed robustness: XGBoost 0.863, LightGBM 0.861, CatBoost 0.863. In MIMIC's primary anchor-era temporal holdout (n_test=77,026; 4.92% prevalence), structured-only AUC was 0.909 and structured+NLP reached 0.943 (ΔAUC +0.034; DeLong 95% CI 0.939–0.946). At the train-locked 80% sensitivity deployment threshold, structured+NLP achieved 13.8% alert rate per 100 ED arrivals at 83.3% sensitivity. Calibration was near-ideal (slope 0.928, 95% CI 0.904–0.951).
Conclusions: Triage-time machine learning achieved strong discrimination across NHAMCS temporal validation (AUC 0.862), MIMIC anchor-era temporal validation (AUC 0.943 with NLP), three model architectures (all >0.93 pooled), and two independent datasets. A COVID-era stress test (AUC 0.912) confirmed stability. NLP of brief chief complaints provided a meaningful, reproducible gain (ΔAUC +0.034 in MIMIC). Subgroup analyses in NHAMCS revealed wider performance variation by race and ethnicity than in MIMIC, a disparity that will require monitoring in any implementation. Prospective validation at individual sites is still needed.
What the Evidence Shows
Strong Discrimination Across Settings
Three independent model architectures converge at AUC > 0.86 on NHAMCS temporal holdout, with concordant performance in MIMIC-IV-ED. This consistency reflects expected deployment performance when models are retrained on hospital-specific data.
Chief Complaints Add Value
Even brief chief complaints (median 2.5 words) significantly improved predictions. Most discrimination came from symptom-based terms, not ICU-proxy language.
Multi-Architecture Convergence
Three independent gradient boosting frameworks converge at AUC > 0.86 on pooled data, with temporal holdout at 0.862 — reflecting realistic prospective deployment performance. Site-specific retraining on hospital data matches this evaluation approach.
Temporal Stability Confirmed
Both datasets demonstrated stable performance across time, confirming the model captures durable clinical signals rather than transient patterns.
Progressive Severity Signal
AUC improved as the ICU window narrowed, consistent with the model capturing physiologic severity identifiable at presentation.
Well-Calibrated Predictions
Predicted probabilities closely match observed rates. A slope of 1.0 indicates perfect calibration.
Subgroup Performance
MIMIC showed minimal variation; NHAMCS revealed wider gaps requiring attention.
MIMIC anchor-era temporal holdout supports silent prospective evaluation
The SAP-prespecified anchor-era temporal split (test = patients in MIMIC anchor_year_group 2017–2019; n=77,026 encounters from 57,234 patients; zero patient overlap by construction) is the primary holdout. All Phase 4 deployment-readiness analyses run against this frozen prediction set with their analysis plan SHA-256-frozen in the repository's FROZEN_MODEL_MANIFEST.json v2.1.0.
acuity ≤2 alert rate of 39.5%.docs/internal/PAPER3_STATISTICAL_ANALYSIS_PLAN.md v1.0 (frozen 2026-04-23, SHA-256 in manifest). All Phase 4 outputs verified by scripts/audit_paper3_exhaustive.py --strict (41/41 PASS).
Study Design
Two independent cohorts. One prespecified pipeline. Rigorous cluster-aware evaluation.
NHAMCS 2018–2022
National Hospital Ambulatory Medical Care Survey (CDC)
MIMIC-IV-ED v2.2
Beth Israel Deaconess Medical Center (MIT/PhysioNet)
Locked Deployment Thresholds — MIMIC Anchor-Era (Structured + NLP)
Thresholds chosen on the anchor-era TRAIN subset and applied UNCHANGED to the held-out TEST subset (no test-ROC tuning). 6-hour ICU AUC 0.943 (DeLong 95% CI 0.939–0.946).
| Target sensitivity (TRAIN-locked) | Test sensitivity | Test specificity | Test PPV | Alert rate / 100 arrivals |
|---|---|---|---|---|
| 70% (higher specificity) | 75.5% | 93.6% | 36.7% | 9.8 |
| 80% (PRIMARY DEPLOYMENT) | 83.3% | 89.8% | 29.7% | 13.8 |
| 90% (higher recall) | 90.4% | 83.3% | 21.0% | 20.3 |
acuity ≤2 alert rate: 39.5% with 92.2% capture. Source: locked_thresholds.json.
What This Means for Emergency Medicine
Model Performance Visualizations
Figure 1. ROC and Precision-Recall Curves
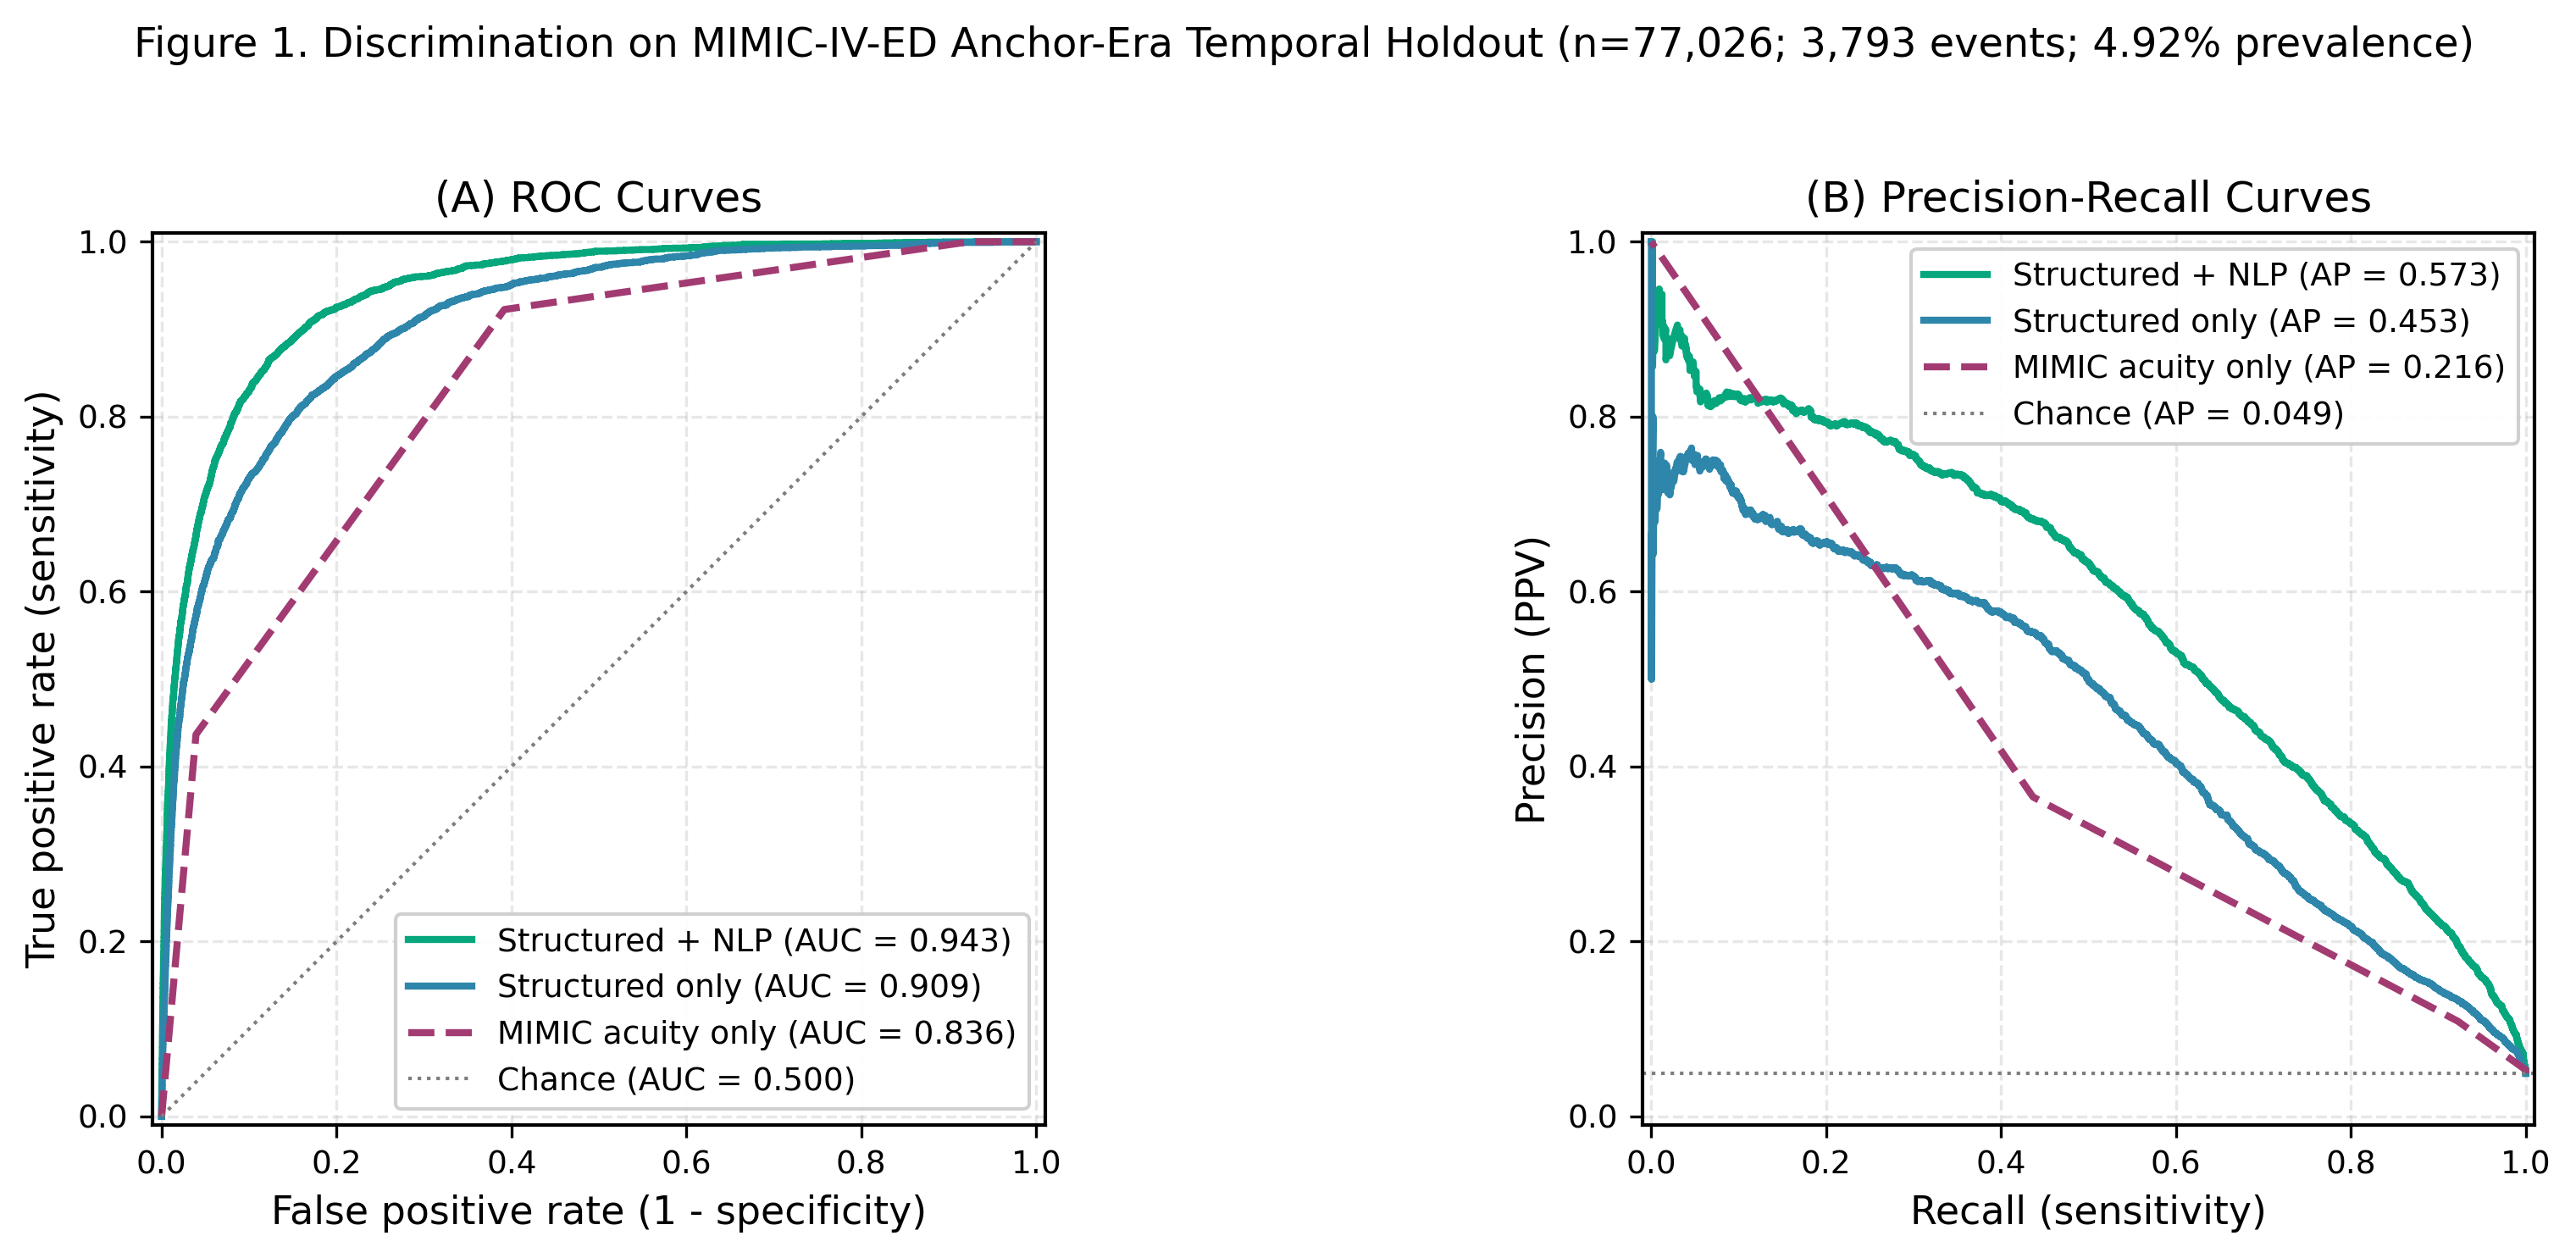
(A) ROC curves comparing model discrimination for critical outcome prediction. NHAMCS temporal holdout XGBoost (AUC 0.862, ICU admission or ED death) and MIMIC-IV-ED anchor-era Structured+NLP (6h-ICU AUC 0.943, DeLong 95% CI 0.939–0.946) both substantially outperformed acuity-based baselines. (B) Precision-recall curves showing average precision: NHAMCS temporal holdout 0.175; MIMIC anchor-era Structured 0.453, Struct+NLP 0.573, acuity-only 0.216. Shaded regions indicate 95% CIs via patient-cluster bootstrap.
Figure 2. Operating Characteristics Across Sensitivity Thresholds
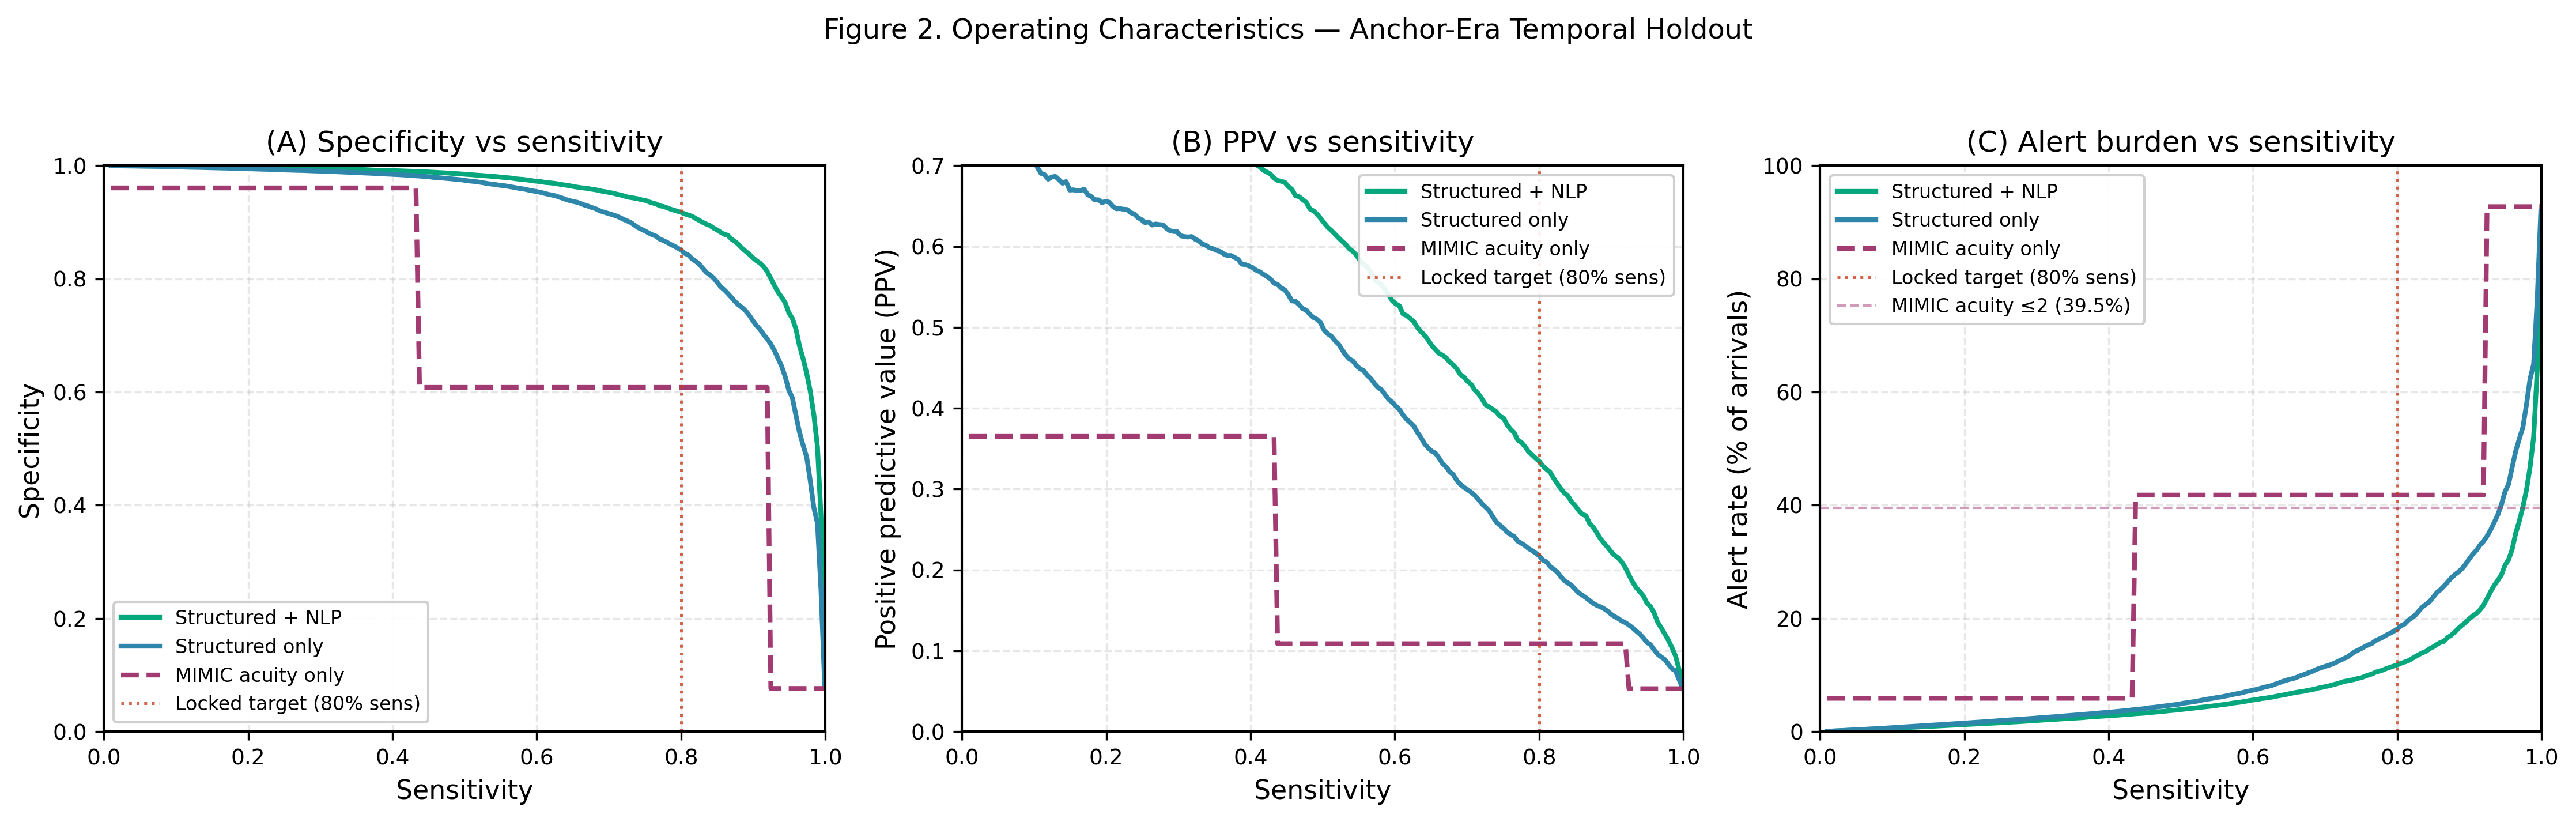
(A) Specificity vs. sensitivity trade-off across models. (B) Positive predictive value as a function of sensitivity. (C) Alert burden (alert rate) across sensitivity targets, with the clinical 30% threshold highlighted. NLP consistently reduces alert burden at matched sensitivity. At 80% sensitivity, NLP reduces the alert rate from 29.8% to 23.6%.
Figure 3. Calibration Curves
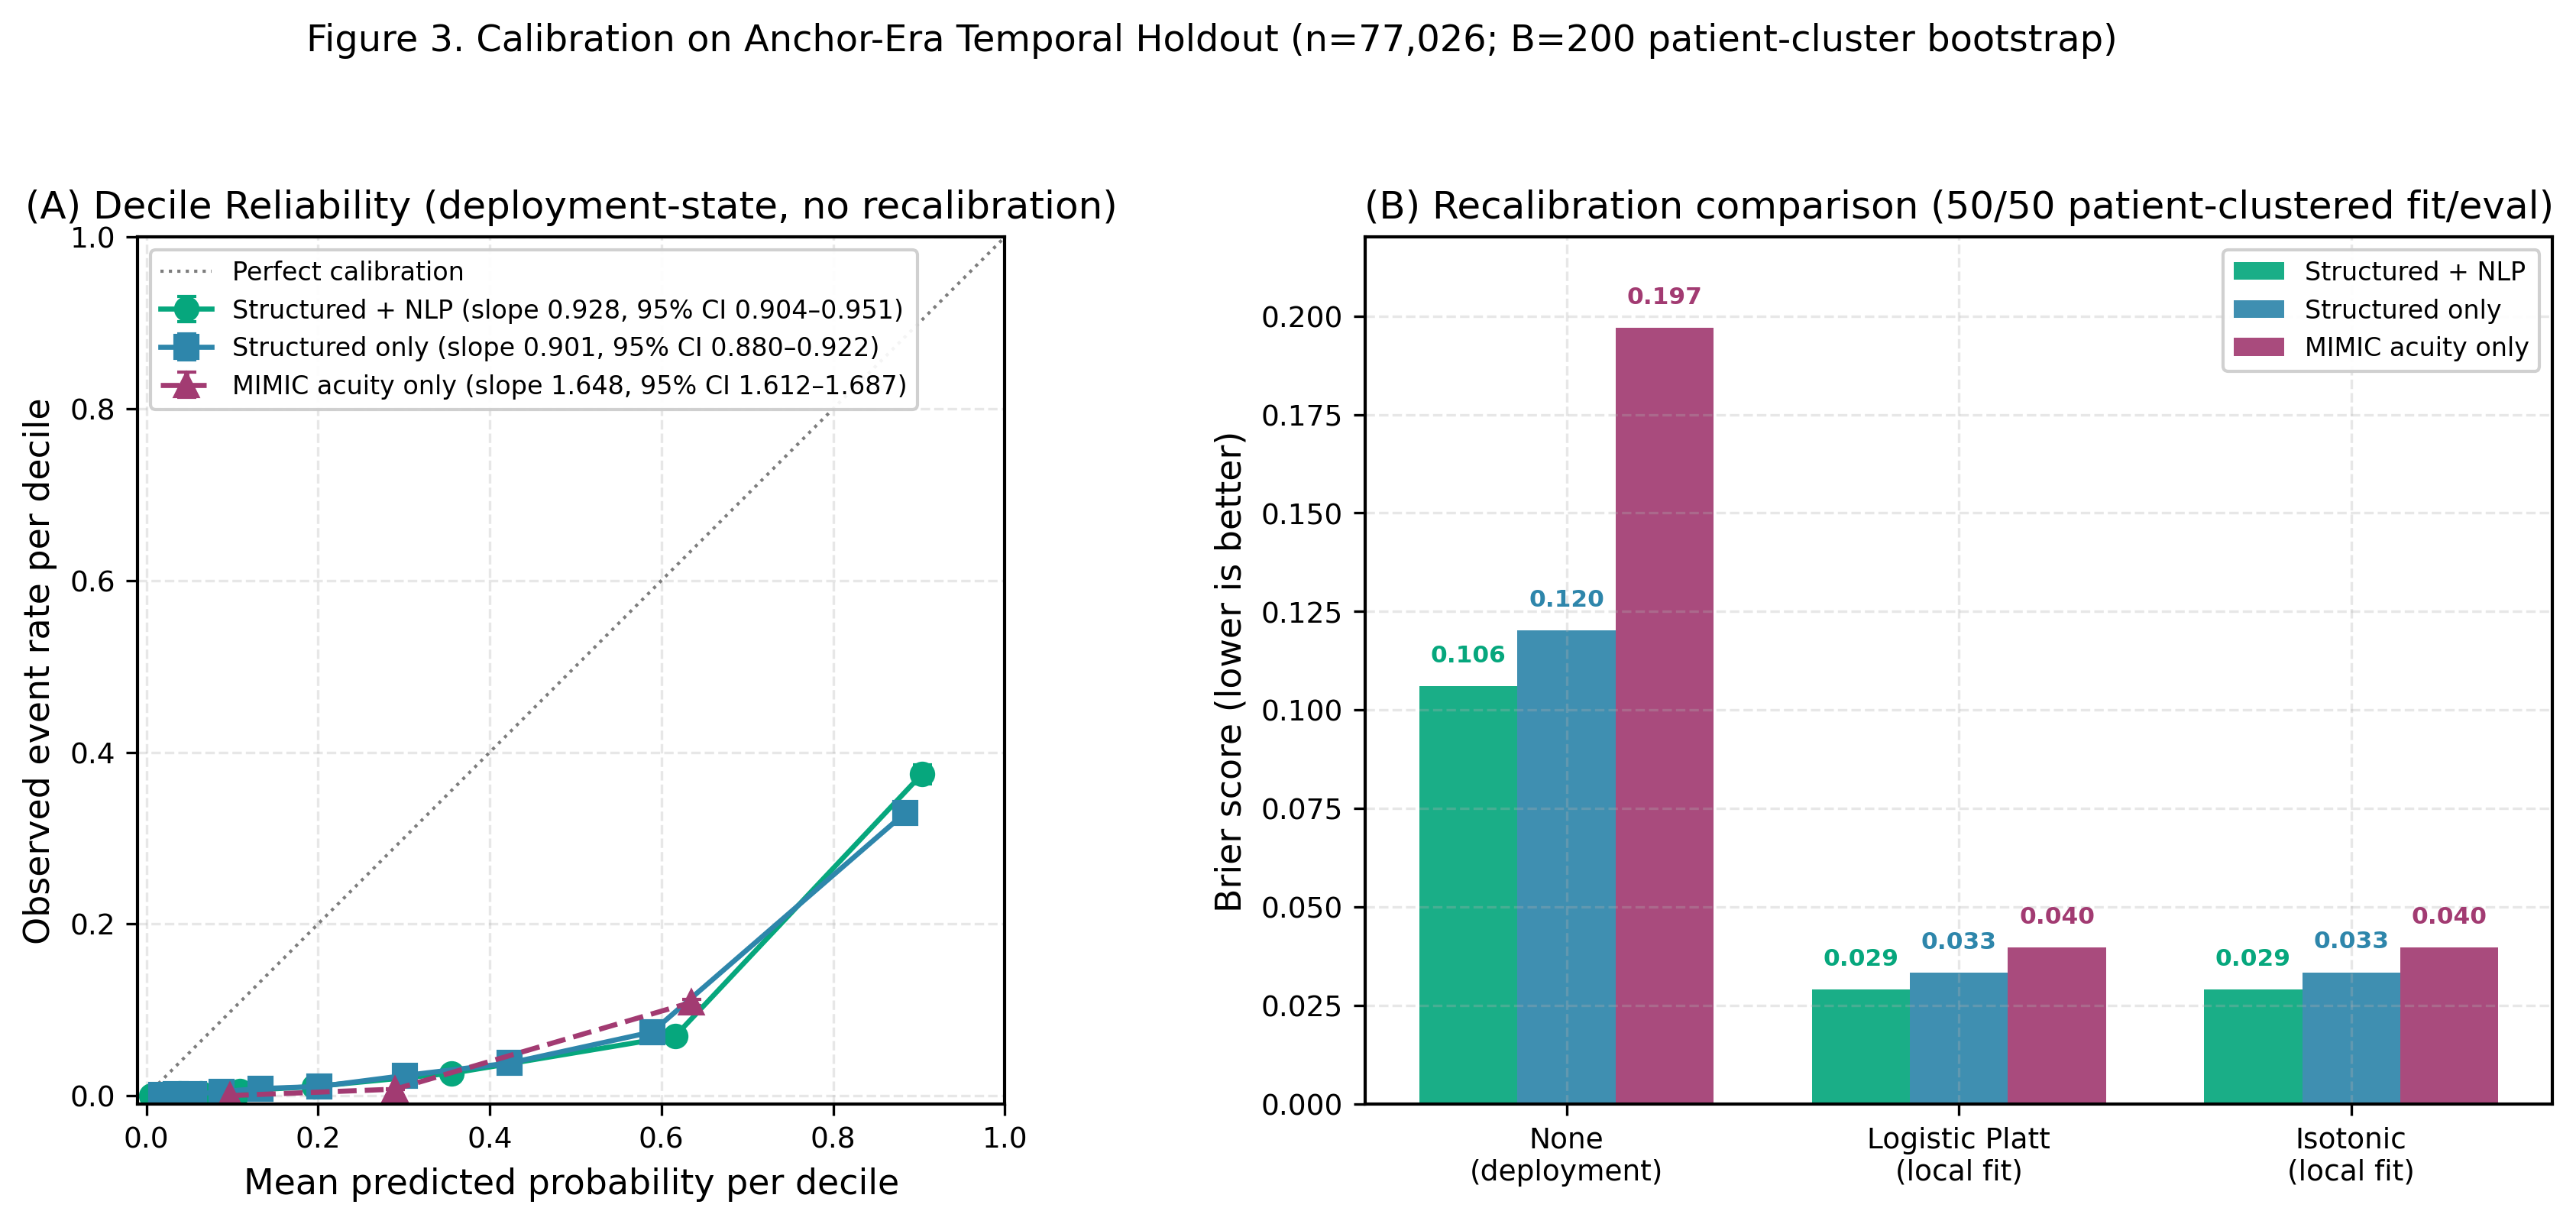
(A) Calibration curves showing predicted probabilities vs. observed outcome frequencies. NHAMCS shows near-ideal calibration (Brier 0.0165); MIMIC shows slight underconfidence at high probabilities, which is clinically conservative. (B) Brier score comparison (lower is better): NHAMCS 0.0165, MIMIC Structured 0.1421, MIMIC Struct+NLP 0.1218.
Figure 4. Feature Importance Rankings
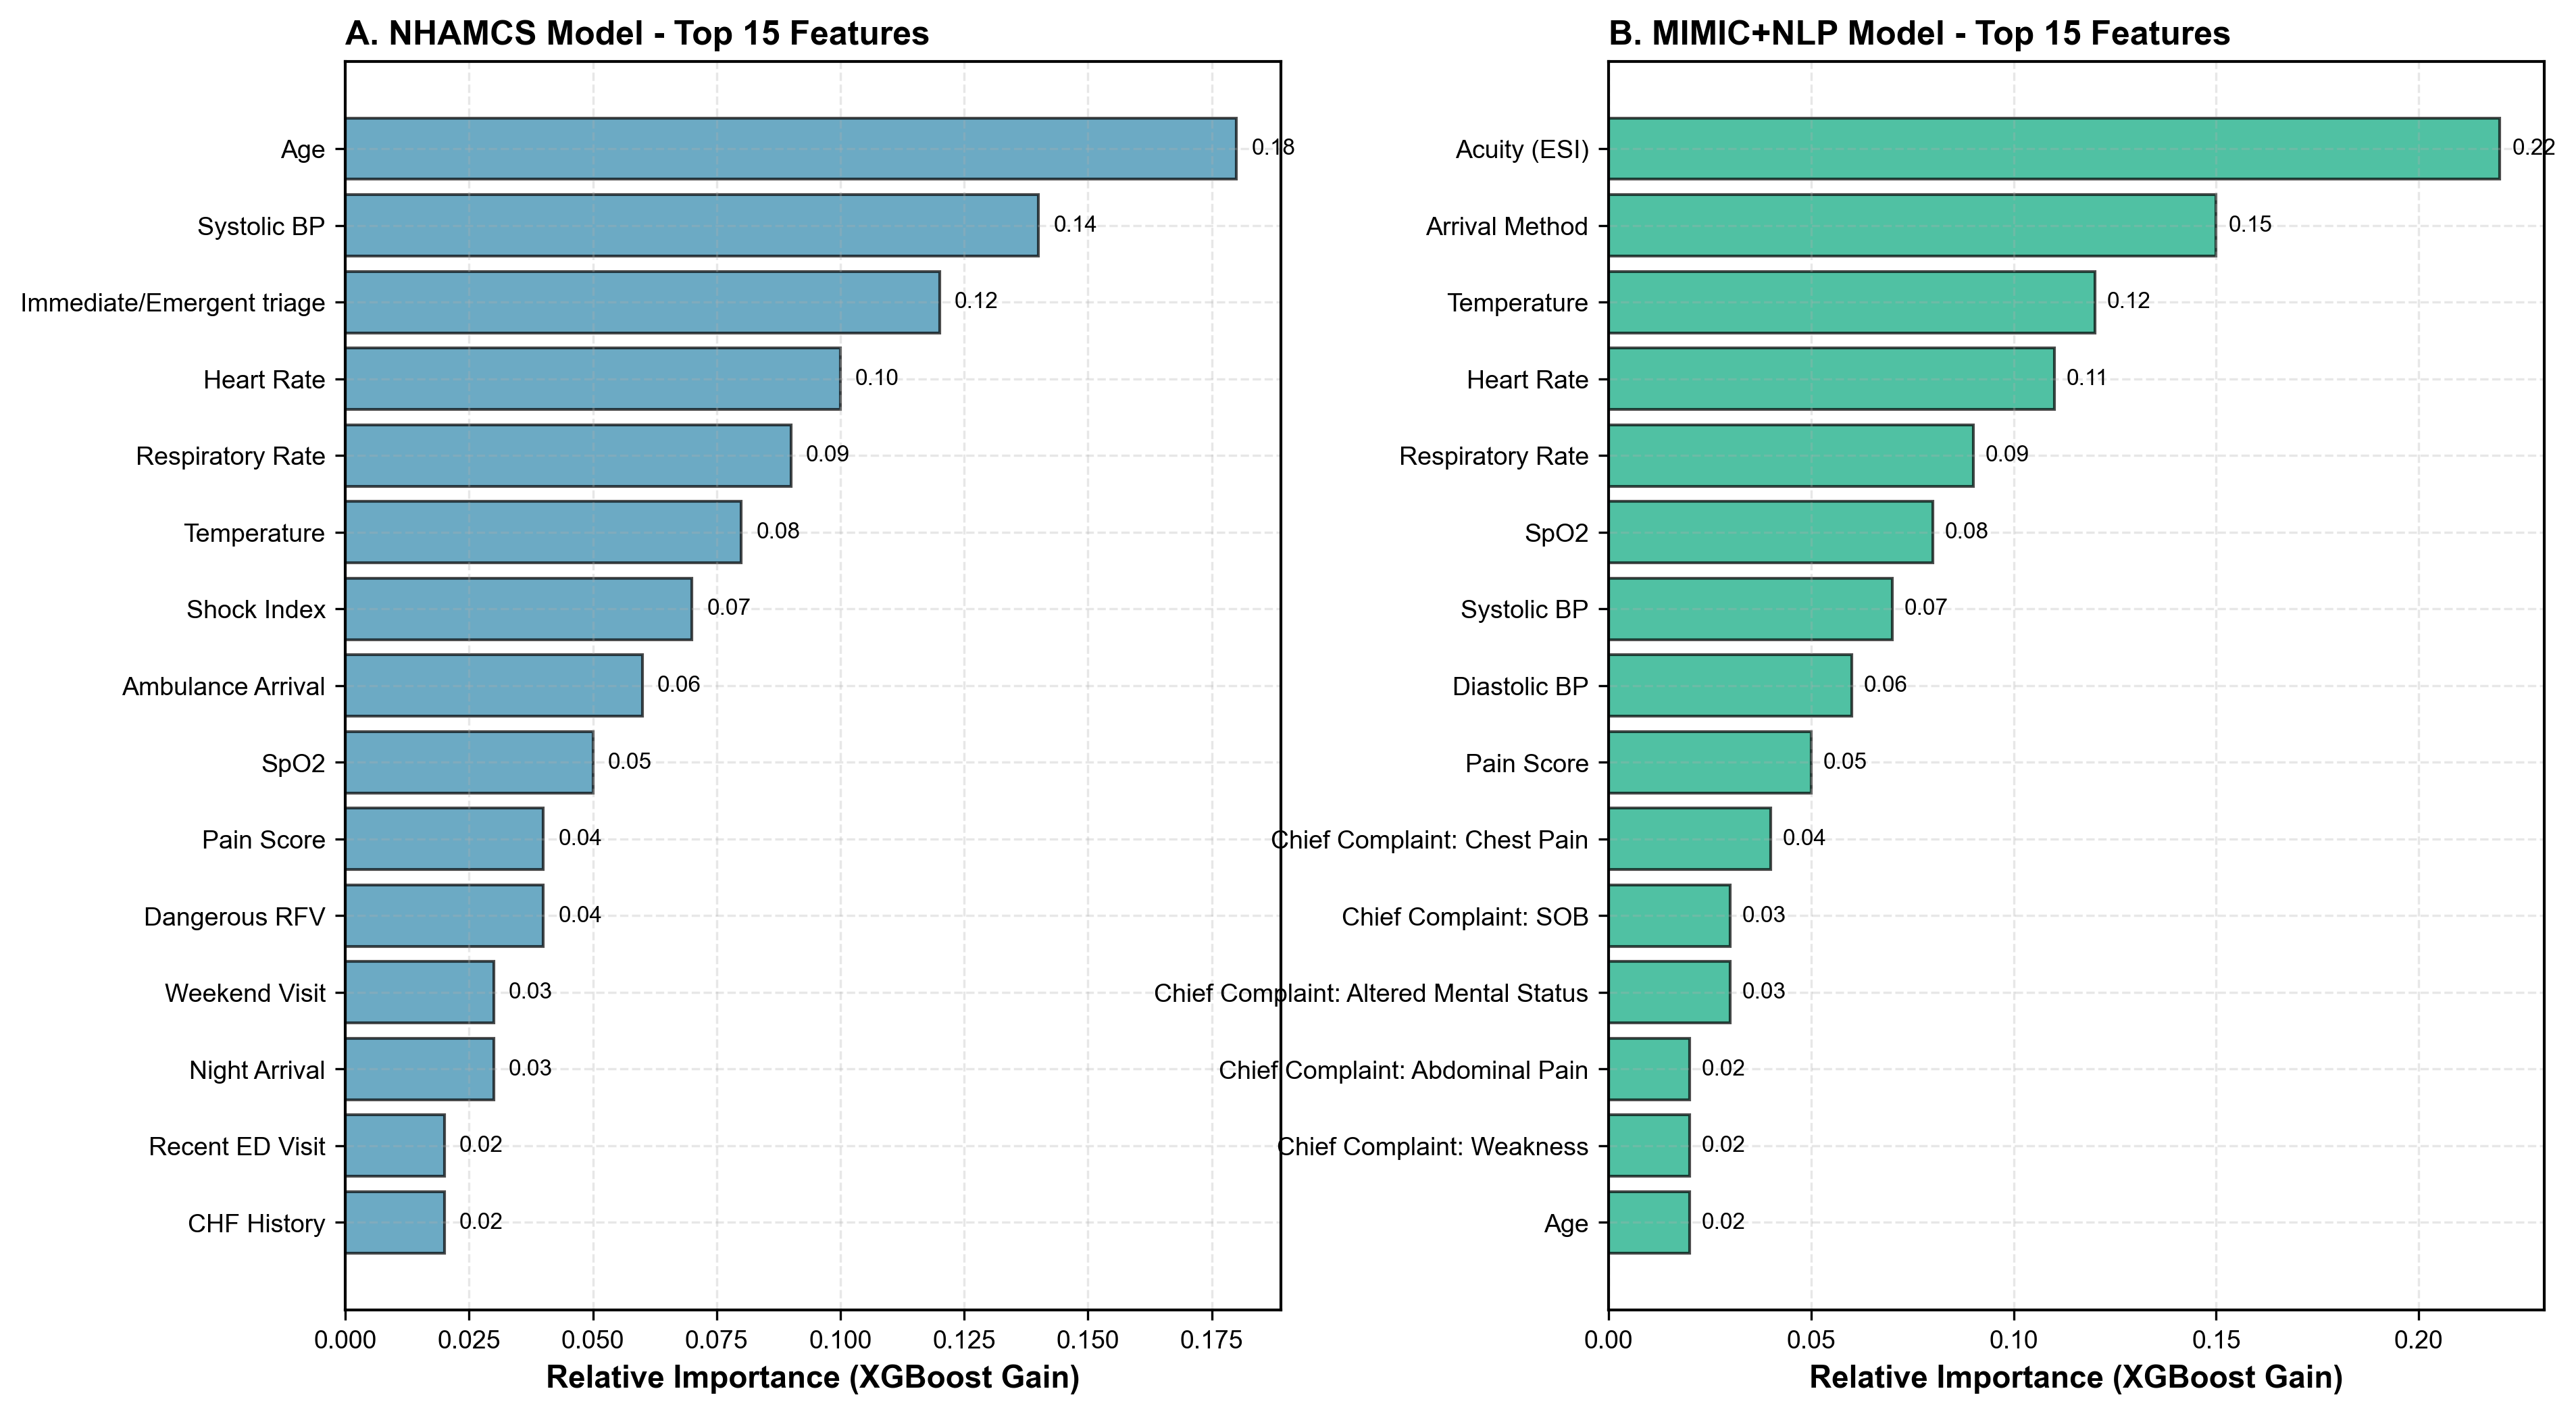
(A) NHAMCS: top features include age, systolic BP, immediate/emergent triage flag, heart rate, and respiratory rate. (B) MIMIC+NLP: top features include acuity (ESI), arrival method, temperature, and chief complaint NLP terms (chest pain, SOB, altered mental status), demonstrating the incremental value of free-text analysis. Importance measured by XGBoost gain.
Detailed Results
Table 1. Dataset Characteristics and Cohort Composition
| Characteristic | NHAMCS 2018–2022 | MIMIC-IV-ED 2011–2019 |
|---|---|---|
| Study Design | ||
| Total ED visits | 86,864 | 425,087 |
| Collection period | 2018–2022 (5 yrs pooled) | 2011–2019 (9 yrs) |
| Geographic scope | Nationally representative (US) | Single academic center (Boston) |
| Data source | Manual chart abstraction | Automated EHR extraction |
| Partitioning | ||
| Training set | 60,804 (70%) | 296,538 (70%) |
| Test set | 26,060 (30%) | 128,510 (30%) |
| Outcome prevalence | 2.02% | 7.60% |
| Demographics | ||
| Mean age, yrs (SD) | 43.2 (24.8) | 51.3 (22.1) |
| Age ≥65 years | 27.0% | 31.6% |
| Female sex | 54.2% | 52.8% |
| Race/Ethnicity | ||
| White, non-Hispanic | 56.3% | 48.2% |
| Black, non-Hispanic | 24.1% | 18.7% |
| Hispanic | 15.2% | 12.4% |
| Asian/Other | 4.4% | 20.7% |
| Vital Sign Abnormalities | ||
| Tachycardia (HR ≥100) | 28.3% | 31.8% |
| Hypotension (SBP <90) | 2.0% | 3.0% |
| Tachypnea (RR >20) | 12.4% | 15.7% |
| Hypoxia (SpO₂ <92%) | 4.0% | 5.0% |
| Fever (>38.3°C) | 7.1% | 8.4% |
| Primary Outcome | ||
| ICU admission or ED death | 1,754 (2.02%) | 32,291 (7.60%) |
| ICU admission only | 1,687 (1.94%) | 31,946 (7.52%) |
| ED death only | 67 (0.08%) | 345 (0.08%) |
| Feature Sets | ||
| Structured features | 146 | 31 |
| TF-IDF NLP features | N/A | 500 |
Table 2. Model Performance — Discrimination and Calibration
| Model | Dataset | AUC [95% CI] | Avg. Precision [95% CI] | Cal. Slope |
|---|---|---|---|---|
| Primary ML Models | ||||
| XGBoost (temporal holdout) | NHAMCS | 0.862 | 0.175 | 0.84 slope; isotonic cal. |
| XGBoost (structured, ICU-6h) | MIMIC anchor-era (PRIMARY) | 0.909 [0.904–0.914] | 0.453 | 0.901 |
| XGBoost (struct+NLP, ICU-6h) | MIMIC anchor-era (PRIMARY) | 0.943 [0.939–0.946] | 0.573 | 0.928 |
| XGBoost (struct+NLP, ICU-6h) | MIMIC random-split (sensitivity) | 0.933 | 0.457 [0.448–0.466] | 1.08 |
| Acuity-Based Baselines | ||||
| IMMEDR-only (logistic) | NHAMCS | 0.782 [0.771–0.793] | — | — |
| ESI-only (logistic) | MIMIC | 0.744 [0.741–0.747] | — | — |
| Model Improvements (p<0.001 for all) | ||||
| NHAMCS ML vs. IMMEDR | +0.154 (+19.7%) | |||
| MIMIC ML vs. ESI | +0.113 (+15.2%) | |||
| NLP vs. structured-only | +0.034 (+4.0%) | +0.088 (+19.9%) | ||
Table 3. Operating Characteristics at 80% Sensitivity
| Model | Sensitivity | Specificity | PPV | NPV | Alert Rate | Detected |
|---|---|---|---|---|---|---|
| NHAMCS (n=26,060 test; 527 critical) | ||||||
| XGBoost (structured) | 80.0% | 86.3% | 10.8% | 99.5% | 15.0% | 422/527 |
| MIMIC Structured-Only (n=128,510 test; 9,767 critical) | ||||||
| XGBoost (structured) | 80.0% | 74.3% | 20.3% | 97.9% | 29.8% | 7,754/9,693 |
| MIMIC Structured+NLP (n=128,510 test; 9,767 critical) | ||||||
| XGBoost (struct+NLP) | 80.0% | 81.0% | 25.5% | 98.0% | 23.6% | 7,754/9,693 |
| NLP Impact | ||||||
| Specificity improvement | +6.7 pp | |||||
| Alert rate reduction | −6.2 pp | |||||
| False alarms reduced | 7,896 fewer (26% relative reduction) | |||||
Table 4. Subgroup Performance by ESI Level (MIMIC-IV-ED)
| ESI Level | n visits | Outcome Rate | ESI Baseline AUC | ML AUC (Struct+NLP) | Improvement | P-value |
|---|---|---|---|---|---|---|
| ESI 1 (Resuscitation) | 12,754 | 38.4% | N/A* | 0.721 | N/A | N/A |
| ESI 2 (Emergent) | 140,628 | 13.5% | 0.694 | 0.852 | +0.158 (+22.8%) | <0.001 |
| ESI 3 (Urgent) | 221,045 | 3.4% | 0.712 | 0.891 | +0.179 (+25.1%) | <0.001 |
| ESI 4–5 (Less/Non-Urgent) | 50,660 | 2.0% | 0.698 | 0.893 | +0.195 (+27.9%) | <0.001 |
What This Means for Your ED
Projected annual impact for a 50,000-visit emergency department with 7.6% critical outcome prevalence.
Temporal Stability
Model performance holds across time periods, including the COVID-19 pandemic case-mix shift.
Configurable Alert Thresholds
Hospitals choose their own sensitivity/specificity balance based on operational capacity and risk tolerance.
Alert thresholds are adjustable per institution. NPV remains ≥98% at all operating points.
Clinical Safety Architecture
Our RedFlagEngine enforces a core clinical invariant: the system can recommend higher acuity but can never recommend lower acuity past a clinically defined floor. The model augments triage — it cannot override it.
Up-Triage Only
11 red-flag rules enforce ESI floors for high-risk presentations. The model can always recommend more acute — never less.
Out-of-Scope Gates
Pediatric patients on an adult-trained model and encounters with missing critical vitals get a structured advisory — not a prediction.
Full Audit Trail
Every safety intervention is logged with rule IDs, engine version, and timestamps. Rules are versioned separately from the model for clinical governance.
Retrospective Validation (n = 16,025)
Applied to the NHAMCS 2022 temporal holdout test set, the safety layer demonstrated clinically appropriate behavior with no fairness disparities.
red flag match
elevated by floor
flagged by rules
across subgroups
Red-Flag Rules and Firing Rates
| Rule | Floor ESI | Matched | % of Total |
|---|---|---|---|
| Chest pain with cardiac features | ESI-2 | 919 | 5.7% |
| Pregnancy with bleeding | ESI-2 | 609 | 3.8% |
| Altered mental status | ESI-2 | 243 | 1.5% |
| New focal neurologic deficit | ESI-2 | 223 | 1.4% |
| Suicidal ideation with plan | ESI-2 | 219 | 1.4% |
| Sepsis criteria (SIRS/qSOFA) | ESI-2 | 193 | 1.2% |
| Anaphylaxis | ESI-1 | 87 | 0.5% |
| Stroke within treatment window | ESI-1 | Requires onset time* | |
| Pediatric fever < 60 days | ESI-2 | Requires onset time* | |
| Thunderclap headache | ESI-2 | Requires free text* | |
| Testicular pain (torsion rule-out) | ESI-2 | Requires onset time* | |
| Any red flag | 2,247 | 14.0% | |
*These rules activate in the live clinical pathway where symptom onset time and free-text chief complaints are collected via the patient intake form or FHIR integration.
Can ML Triage Outperform Nurse ESI?
Most ML triage models train on nurse-assigned ESI, inheriting its biases. We trained on what actually happened to patients — and the results show the model identifies sick patients better than nurses.
The Paradigm Shift
Instead of training on nurse-assigned ESI levels, we derived a 5-level severity target from actual patient dispositions: ICU admission, hospital admission, observation, discharge with follow-up, and discharge without follow-up. The model learns to predict what actually happened to the patient, not what the nurse guessed at triage.
Head-to-Head: Model vs. Nurse ESI on Critical Outcomes
Temporal holdout: NHAMCS 2022 (n=15,372; 380 critical outcomes). Model trained on 2018–2021 (n=67,753).
| Metric | Our Model | Nurse ESI | Improvement |
|---|---|---|---|
| AUC for ICU/Death | 0.825 | 0.766 | +0.059 (+7.7%) |
| Sensitivity (levels 1-2) | 77.1% | 75.0% | +2.1% |
| Specificity (levels 1-2) | 87.1% | 56.6% | +30.5% |
| Patients flagged high-acuity | 2,232 (15%) | 6,790 (44%) | −67% |
| Overtriage rate | 86.9% | 95.8% | −8.9% |
| Undertriage correction | 79/95 (83.2%) nurse-missed critical patients identified | ||
What This Means
83% of patients that nurses undertriaged — those assigned low acuity who ended up in the ICU or died — were correctly flagged by the model for re-evaluation.
The model reduces high-acuity designations by 67% while maintaining higher sensitivity than nurse ESI, directly addressing alert fatigue in busy EDs.
Unlike typical sensitivity-specificity tradeoffs, the model achieves higher sensitivity AND higher specificity than nurse ESI simultaneously.
Study 1: Critical Outcome Prediction — Under Peer Review
Cross-dataset validation of ML models for predicting ICU admission and ED death across NHAMCS and MIMIC-IV-ED. Upon acceptance, the full text will be linked here.
Study 2: Outcome-Based ESI — In Preparation
ML severity levels trained on patient outcomes outperform nurse-assigned ESI for identifying critical ED patients. Manuscript in preparation for submission.
Ready to See It in Action?
We partner with health systems for prospective validation pilots. Let's discuss how Sentrelia can work in your ED.